Economics > Supply Curve
The Supply Curve
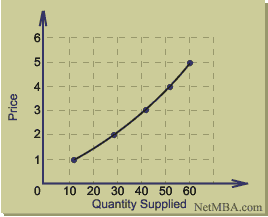
Price usually is a major determinant in the quantity supplied. For a particular good with all other factors held constant, a table can be constructed of price and quantity supplied based on observed data. Such a table is called a supply schedule, as shown in the following example:
Supply Schedule
Price |
Quantity |
1 |
12 |
2 |
28 |
3 |
42 |
4 |
52 |
5 |
60 |
By graphing this data, one obtains the supply curve as shown below:
Supply Curve

As with the demand curve, the convention of the supply curve is to display quantity supplied on the x-axis as the independent variable and price on the y-axis as the dependent variable.
The law of supply states that the higher the price, the larger the quantity supplied, all other things constant. The law of supply is demonstrated by the upward slope of the supply curve.
As with the demand curve, the supply curve often is approximated as a straight line to simplify analysis. A straight-line supply function would have the following structure:
Quantity = a + (b x Price)
where a and b are constant for each supply curve.
A change in price results in a change in quantity supplied and represents movement along the supply curve.
Shifts in the Supply Curve
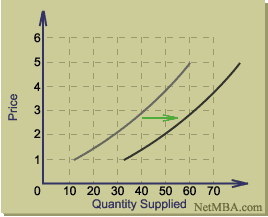
While changes in price result in movement along the supply curve, changes in other relevant factors cause a shift in supply, that is, a shift of the supply curve to the left or right. Such a shift results in a change in quantity supplied for a given price level. If the change causes an increase in the quantity supplied at each price, the supply curve would shift to the right:
Supply Curve Shift

There are several factors that may cause a shift in a good's supply curve. Some supply-shifting factors include:
Prices of other goods - the supply of one good may decrease if the price of another good increases, causing producers to reallocate resources to produce larger quantities of the more profitable good.
Number of sellers - more sellers result in more supply, shifting the supply curve to the right.
Prices of relevant inputs - if the cost of resources used to produce a good increases, sellers will be less inclined to supply the same quantity at a given price, and the supply curve will shift to the left.
Technology - technological advances that increase production efficiency shift the supply curve to the right.
Expectations - if sellers expect prices to increase, they may decrease the quantity currently supplied at a given price in order to be able to supply more when the price increases, resulting in a supply curve shift to the left.
Economics > Supply Curve


